the effect of road grade variations on climbing power: pt 2
To summarize from last time, the physics behind the effect of grade variations on bike speed is that at constant power grade variations lead to speed variations, and speed variations lead to variations in wind resistance. When the bike moves faster than average, wind resistance is higher, but when it moves slower than average, wind resistance is less. To first order, these cancel, but to second order, the increase in wind resistance from riding above average speed is less than the reduction in wind resistance from riding at below average speed. So the greater the grade fluctuations the speed fluctuations and the higher the average power, even if the average speed is the same.
We've already analyzed the effect of speed fluctuations on average power. That result, assuming no wind resistance, is:
Δp ≈ 3 f p0 <Δs²> / s0²,
where Δp is the change in the average power, p is the average power calculated without modeling the fluctuations, f is the fraction of power from wind resistance, and s0 is the average speed.
So all we need to do to model the relationship between grade changes and speed changes. Well, we've already done it in a previous post; we calculated the effect of fractional mass changes on speed. The key insight is that fractional changes in mass and (grade + CRR) have the same effect. So the model for the result of fractional changes in (grade + CRR) is the same as the modely for the result of fractional changes in mass.
Therefore, almost by inspection the result can be written:
<Δs²> =
s0² [ <Δgrade²> / (grade0 + CRR)² ] × [ ( 1 - f ) / ( 1 + 2 f ) ]²
Then this can be inserted into the first equation, relating speed fluctuations to power:
Δp / p0 ≈
3 f [ <Δgrade²> / (grade0 + CRR)² ] × [ ( 1 - f ) / ( 1 + 2 f ) ]²
That was easy. Note the result is to first order proportional to f. Obviously, if there's no wind resistance, there's no effect: the speed fluctuations only add power because of wind resistance fluctuations; the total energy from climbing depends on total elevation gained, while rolling resistance depends on how far the wheels roll.
So, let's run some real numbers. Assume when climbing Old La Honda Road wind resistance is 12% of the total power.
From iBike data for Old La Honda:
grade0 = 7.26%,
<Δgrade²> = 1.32%,
where in calculating <Δgrade²> the measured gradient was convolved with a smoothing function, a Gaussian profile of σs = 50 meters, to account for the fact we're neglecting inertia; coasting over small grade fluctuations fails to change speed as much as the quasi-static approximation predicts. Note I was careful to use iBike data. That's because the iBike has a built-in gradiometer, which measures grade directly. An alternate would be to use altitude data then differentiate it. But since differentiation tends to amplify the effect of small errors in the estimation of altitude, it would be easy to overestimate the variations in road grade.
CRR = 0.4%,
assuming I'm on my Veloflex Record tubulars, which have nice low rolling resistance.
With these numbers,
Δp / p0 ≈ 0.54%
Wow -- that's quite significant. From a baseline climbing power of 290 watts, that's 1.56 watts.
This can be checked against the actual speed fluctuations recorded by the iBike. Now the iBike data aren't mine, as I noted, so I'll run with the numbers from the iBike rider. A very nice thing about iBike is that it allows for an extraction of an estimate of rolling resistance and wind resistance coefficients from ride data. So I'll use these numbers for the rider in question, who had relatively higher rolling resistance clinchers with butyl inner tubes at lower pressure:
CRR = 0.74%
mass = 75.75 kg
fw = 0.24 kg / m
These yield:
f = 0.66%
I can use the grade fluctuations to estimate the power increase, as before:
Δp / p0 ≈ 0.44%
Or I can use the speed fluctuations directly:
√<Δs²> = 11.9%
Then with the first equation:
Δp / p0 ≈ 0.36%
Okay, not perfect, but in the ballpark. We can plot the speed fluctuations versus grade, where I did a 3-second exponentially-weighted smoothing of the grade data to try and account for inertia, to check how well the constant power quasi-static model predicts the effect of grade on speed variation:
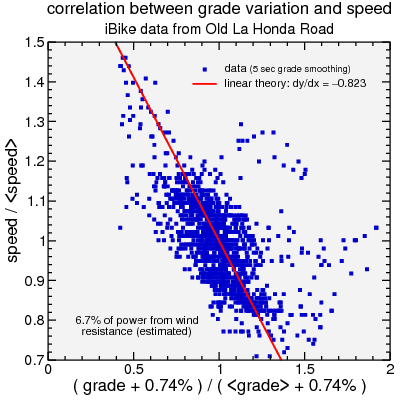
Old La Honda iBike data: effect of grade fluctuations on speed fluctuations
The trend is right, but obviously there's a lot of deviation from the trend. It's clear there are plenty of points where the grade has increased but the speed has not decreased with the trend line. The rider thus tended to try to keep constant speed rather than ride at constant power. This reduced the required power generated, but may have taken a physiological toll. However, analyzing that is beyond the scope of simple physics.
We've already analyzed the effect of speed fluctuations on average power. That result, assuming no wind resistance, is:
Δp ≈ 3 f p0 <Δs²> / s0²,
where Δp is the change in the average power, p is the average power calculated without modeling the fluctuations, f is the fraction of power from wind resistance, and s0 is the average speed.
So all we need to do to model the relationship between grade changes and speed changes. Well, we've already done it in a previous post; we calculated the effect of fractional mass changes on speed. The key insight is that fractional changes in mass and (grade + CRR) have the same effect. So the model for the result of fractional changes in (grade + CRR) is the same as the modely for the result of fractional changes in mass.
Therefore, almost by inspection the result can be written:
<Δs²> =
s0² [ <Δgrade²> / (grade0 + CRR)² ] × [ ( 1 - f ) / ( 1 + 2 f ) ]²
Then this can be inserted into the first equation, relating speed fluctuations to power:
Δp / p0 ≈
3 f [ <Δgrade²> / (grade0 + CRR)² ] × [ ( 1 - f ) / ( 1 + 2 f ) ]²
That was easy. Note the result is to first order proportional to f. Obviously, if there's no wind resistance, there's no effect: the speed fluctuations only add power because of wind resistance fluctuations; the total energy from climbing depends on total elevation gained, while rolling resistance depends on how far the wheels roll.
So, let's run some real numbers. Assume when climbing Old La Honda Road wind resistance is 12% of the total power.
From iBike data for Old La Honda:
grade0 = 7.26%,
<Δgrade²> = 1.32%,
where in calculating <Δgrade²> the measured gradient was convolved with a smoothing function, a Gaussian profile of σs = 50 meters, to account for the fact we're neglecting inertia; coasting over small grade fluctuations fails to change speed as much as the quasi-static approximation predicts. Note I was careful to use iBike data. That's because the iBike has a built-in gradiometer, which measures grade directly. An alternate would be to use altitude data then differentiate it. But since differentiation tends to amplify the effect of small errors in the estimation of altitude, it would be easy to overestimate the variations in road grade.
CRR = 0.4%,
assuming I'm on my Veloflex Record tubulars, which have nice low rolling resistance.
With these numbers,
Δp / p0 ≈ 0.54%
Wow -- that's quite significant. From a baseline climbing power of 290 watts, that's 1.56 watts.
This can be checked against the actual speed fluctuations recorded by the iBike. Now the iBike data aren't mine, as I noted, so I'll run with the numbers from the iBike rider. A very nice thing about iBike is that it allows for an extraction of an estimate of rolling resistance and wind resistance coefficients from ride data. So I'll use these numbers for the rider in question, who had relatively higher rolling resistance clinchers with butyl inner tubes at lower pressure:
CRR = 0.74%
mass = 75.75 kg
fw = 0.24 kg / m
These yield:
f = 0.66%
I can use the grade fluctuations to estimate the power increase, as before:
Δp / p0 ≈ 0.44%
Or I can use the speed fluctuations directly:
√<Δs²> = 11.9%
Then with the first equation:
Δp / p0 ≈ 0.36%
Okay, not perfect, but in the ballpark. We can plot the speed fluctuations versus grade, where I did a 3-second exponentially-weighted smoothing of the grade data to try and account for inertia, to check how well the constant power quasi-static model predicts the effect of grade on speed variation:
Old La Honda iBike data: effect of grade fluctuations on speed fluctuations
The trend is right, but obviously there's a lot of deviation from the trend. It's clear there are plenty of points where the grade has increased but the speed has not decreased with the trend line. The rider thus tended to try to keep constant speed rather than ride at constant power. This reduced the required power generated, but may have taken a physiological toll. However, analyzing that is beyond the scope of simple physics.


Comments